READ FIRST: Disclaimer – Malware can destroy data, damage your computer, cause your computer to damage other computers, steal information, or cause other harm to property and even life in the case of a system which is in control of some equipment or machinery. When analyzing malware, you must always do so on a machine which has no personal identifying information, you do not personally value, and which is de-networked (not connected) to any other device of value to you or anyone else. If you choose to use the techniques described in this article, you are agreeing that you understand this notice and that you use the information at your own risk. PC Pitstop, Inc. is not responsible for any damage to property or life as a result of following the advice of or otherwise using the information on this page. The proper way to analyze malware is on a de-networked device with no private information, which is not in the position of controlling any equipment, and/or an isolated virtual-machine environment subscribing to those same terms. If you do not understand or do not agree to the above terms, please exit this post and do not follow any information in it to analyze malware.
Intro
If you’ve been a Windows user for a while,chances are, you’ve seen dll files and errors associated with them. Chances are, you also are aware that you cannot “double-click” dll files to run them, or just run them at the commandline. DLL files are technically still executable files because they house executable binary code and in fact, they are of the same format as a .exe file is. The main code differences are there is a bit set in DllCharacteristics of the file’s PE header and there are also exported functions rather than a typical main/WinMain function which starts when a .exe file is run.
Knowing how to analyze DLL malware is important for two reasons:
- Without knowing how to load up the DLL, we cannot perform any dynamic analysis
- There is some very bad and prevalent DLL malware out in the wild
- DLLs can be loaded into legitimate processes, causing normal programs to conduct malicious behavior
- Malware can sometimes step around security software by making calls to DLL loaders like rundll32.exe, which is an allowed Microsoft file
The Loader
The main technical difference that differentiates DLLs from EXE files is the loading process. In a regular EXE, when a user double-clicks the file, the Windows PE Image Loader parses the PE headers, performs some integrity checks, and sets up all of the memory sections for the file. These memory sections include the .text or .code section, the .data section, .rdata section, and more. In fact, other, non-standard sections can be added if a programmer desires. These sections, when mapped (loaded) into active RAM, may not be mapped in the same position they were in sitting in the PE file on disk. The important thing to note is that DLL files have most of these same traits (multiple sections, PE header, etc..) except that the Windows PE Loader will not load them directly for a user.
The purpose of DLL files is to be a collection of functionality (a “library”) that other programs can utilize. Thus, programs can directly load DLLs in a variety of ways; one way being using the API calls LoadLibrary or LoadLibraryEx, followed by GetProcAddress to locate the address of a specific function in the DLL. This is essentially what rundll32.exe does when it is passed a dll file and function as arguments. This is also why we often see LoadLibrary and GetProcAddress used in malware which implements its own custom loader to load up DLLs which were not specified in the PE Header.
The morale of the story is that another program is needed to load a DLL file. We will cover 3 separate ways using 3 separate programs which can be used to load DLLs in this post, as well as instructions on how to load them.
#1 – Rundll32.exe for basic dynamic analysis
This is the simplest method to load a DLL file but also doesn’t conitribute to analysis directly. Open up a Command Prompt window. On newer versions of Windows, you can simply hit the Windows key on the keyboard and then type “cmd” and press enter to do this. Now, navigate to the file on disk using the cd command and once you are in the directory with the dll you want to analyze, you type:
rundll32.exe DllToAnalyze.dll
which wil automatically load DllMain, which is much like a standard main function in a regular exe. To access a function other than DllMain, you have a couple of options. The first option is specifying the function by its function name like this:
rundll32.exe DllToAnalyze.dll,FunctionToRun several parameters here separated by spaces
The second option is to call the function by ordinal, which is just a identification number associated with the function:
rundll32.exe DllToAnalyze.dll,#5
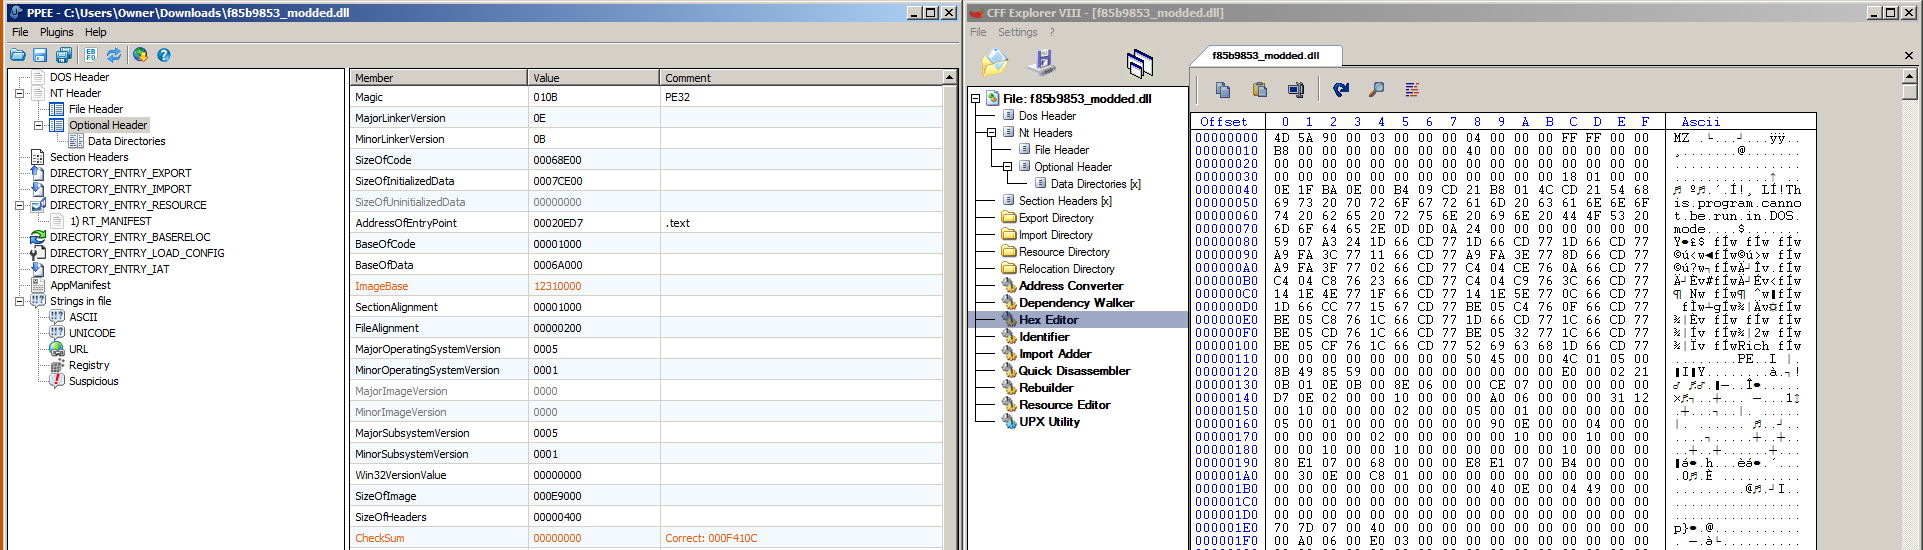
This would call the function which has the ordinal #5. View the below screenshot to understand how an ordinal is associated with a function:
These ordinals are arbitrary and do not necessary follow a standard format between different DLLs. Unfortunately with rundll, passing in arguments to functions can get tricky so there are some limitations on which exported functions we can call this way. One limitation is that the calling convention of the function must be _stdcall. There are a few other limitations listed on the Microsoft Support page. The biggest caution here is that when rundll32 fails, it may not notify the user so the user may think the function is simply not working when in reality, rundll32 was supplied improper arguments.
The purpose of doing this to analyze files requires an analyst to first have dynamic monitoring tools running and ready to go. So before executing a rundll32 call to a dll, start up the necessary monitoring tools like ProcMon, Process Explorer, Process Hacker, Wireshark, etc… Once the DLL is executed, remember to watch the behaviors of rundll32.exe instead of the dll file directly and then turn monitoring off and analyze using the tools shortly thereafter.
#2 – OllyDbg/x64Dbg Loader
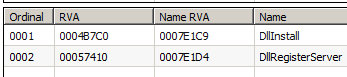
Debuggers such as OllyDbg and x64Dbg come with DLL loaders which are capable of loading a given DLL at an entry-point of the analyst’s choosing. See this screenshot for an example of using the OllyDbg loader to load a DLL:
Most of the time, these types of loaders must be accessed from a menu, which can add to the confusion of beginning analysts since the file will not simply break at the start like a .exe file does. To access the loader options in OllyDbg, open up a DLL file and choose yes to have it loaded, then go to Debug -> Call DLL Export at the top of your OllyDbg window. This is only available if you’ve opened a DLL file inside OllyDbg.
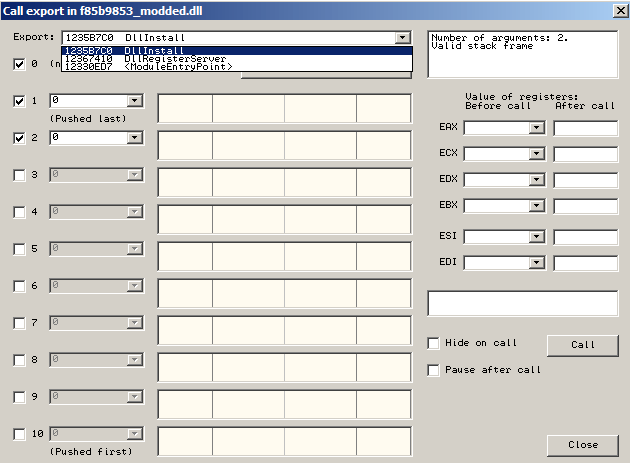
As you can see, OllyDbg allows you to jump to the function’s assembly code as well as even pass arguments to the function as seen in item 2. Finally, the Call button at the bottom right (#3) invokes the function so that EIP is now pointing at the start of it and the analyst can debug as if the file were a normal exe from this point.
#3 – IDA Pro
The Interactive Disassembler aka IDA Pro also has the ability to load DLL files. Not only is IDA Pro a disassembler, but it is also a debugger. To load a DLL, go to Debugger -> Process Options and set up your settings like so:
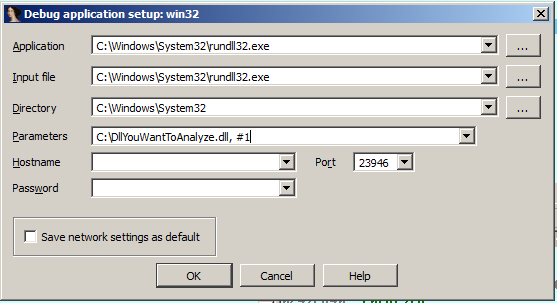
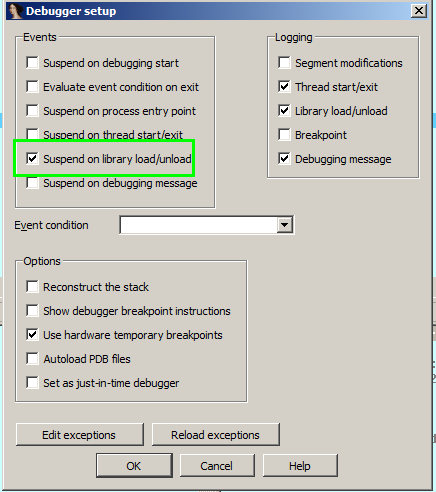
As you can see, we are actually using rundll32.exe like we did earlier, but we’re using it in a slightly different way because IDA Pro will take control of it. IDA Pro does not have it’s own DLL Loader like OllyDbg does. This may seem strange at first because what we are actually doing is debugging rundll32.exe rather than our malware DLL. However, rundll32.exe executes the malicious code this way so what we now need to do is get from Rundll32’s entrypoint to the point at which our malicious DLL is loaded in and executed. This would be a tedious process if it weren’t for a sweet option in IDA Pro. Go to Debugger – > Debugger Options and then tick the following check box before clicking OK:
Once this is ticked, go to the file’s entry point (the Rundll’s start which you will see in the disassembly window) and place a breakpoint on it (F2). Now go ahead and press F9. The execution should now be stopped at rundll’s entry point. From this point on, we’re going to pay close attention to the window highlighted below. Note we have shown a full screenshot so that you know which area of the screen that the window is usually found during active debugging. Click the image to enlarge:
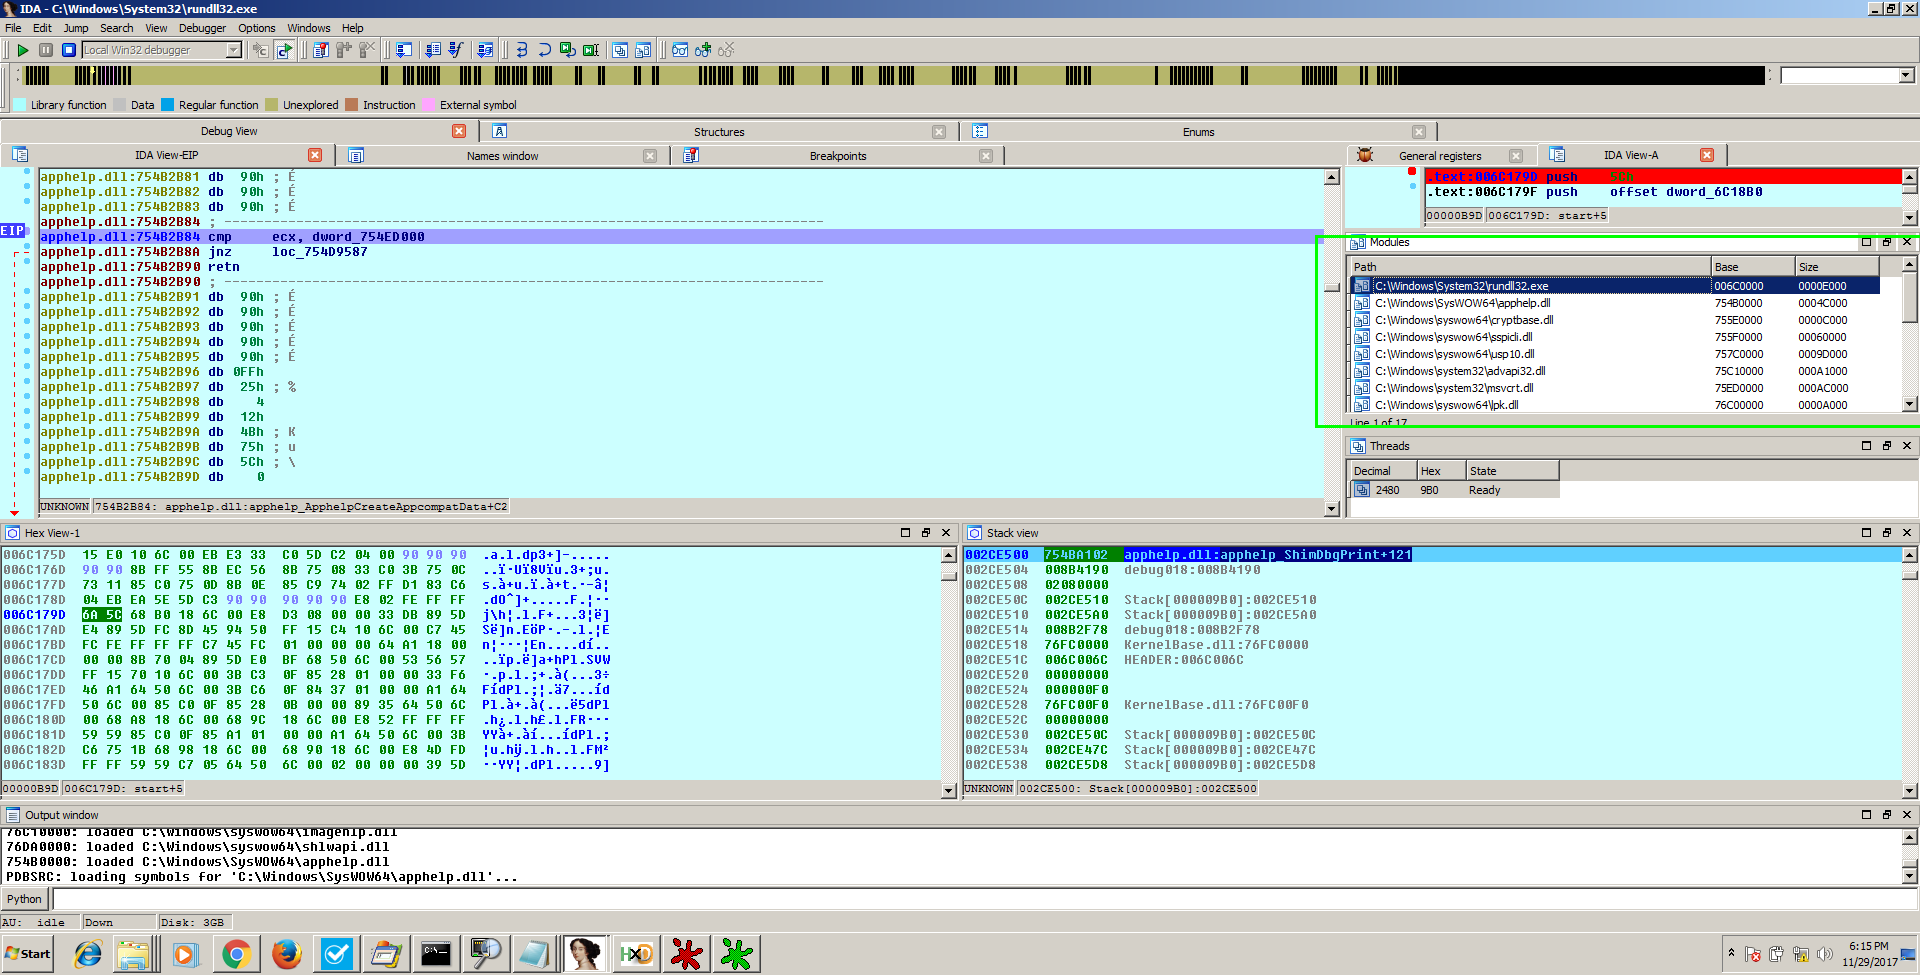
The setting that we just set in the previous step allows us to now press F9 repeatedly and see each new “module” as it is loaded into Rundll32.exe. Note that a “module” is another name for a DLL file. So, the idea now is that we continue to press F9 until we see the DLL we want to analyze appear in that window and we do not press F9 past that point! IF you accidently press F9 too many times, you will have to start over to get back into the DLL’s code. Once the module has been loaded, double click it in the module’s window shown above to be taken to its entry point, press F2 to place a breakpoint on an instruction there and congratulations, you can now analyze the malicious code inside of the DLL which is being executed by rundll32!