READ FIRST: Disclaimer – Malware can destroy data, damage your computer, cause your computer to damage other computers, steal information, or cause other harm to property and even life in the case of a system which is in control of some equipment or machinery. When analyzing malware, you must always do so on a machine which has no personal identifying information, you do not personally value, and which is de-networked (not connected) to any other device of value to you or anyone else. If you choose to use the techniques described in this article, you are agreeing that you understand this notice and that you use the information at your own risk. PC Pitstop Inc. is not responsible for any damage to property or life as a result of following the advice of or otherwise using the information on this page. The proper way to analyze malware is on a de-networked device with no private information, which is not in the position of controlling any equipment, and/or an isolated virtual-machine environment subscribing to those same terms. If you do not understand or do not agree to the above terms, please exit this post and do not follow any information in it to analyze malware.
One of the most effective tools for attacking malware and learning what it does is a debugger. In this post, we will go over what a debugger does, how it can be used to learn about, analyze, and defeat malware, and what malware sometimes does to try and thwart debugger analysis. This post is meant for novice analysts and those looking to learn how to use a debugger.
WHY?
It does no good to jump right into the debugger without first understanding the use cases of why an analyst would want or need to use one to analyze malware in the first place. Here are the reasons:
To examine dynamically-allocated data and instructions
The other similar tool to debuggers are disassemblers. Both tools are considered advanced analysis tools and require knowledge of the architecture’s instruction set. However, a static disassembler such as Hopper, radare2, Binary Ninja, or IDA Pro in static mode, will not expose data which is generated by malware at runtime. This is key and good malware authors know this. For example, observe the following function:
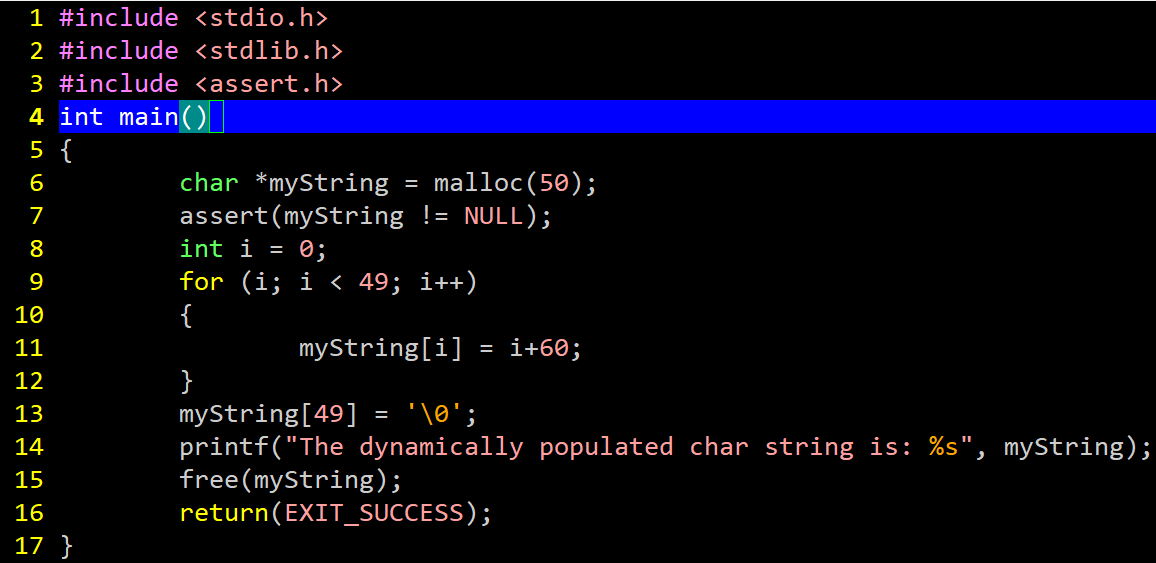
The above program outputs:
The dynamically populated char string is: <=>?@ABCDEFGHIJKLMNOPQRSTUVWXYZ[\]^_`abcdefghijkl
Here is a list of all strings from the entire binary file: https://pastebin.com/vG4jj1PY . Notice that no where does our string appear. Go ahead and press Ctrl+F on the pastebin and see for yourself. This is where a debugger comes in handy.
This function generates some text characters and places them together into a dynamically-allocated array. Since the memory is dynamically allocated and the characters are not placed there until the function actually executes, the phrase which is generated by the function does not appear until the file is executed; it will not be seen in static analysis. Without a debugger, the analyst needs to visualize what the function is doing manually or copy/paste it out of the code and run the function in a separate standalone program. This can be time-consuming and is especially difficult with extremely complicated functions or functions which have purpose-built garbage code and obfuscations to distract or confuse the analyst. Similarly, actual program instructions can be generated at runtime, placed in memory, then executed thereafter. In fact, some encryption keys, server addresses, IP addresses, and other useful info will be generated at runtime and if we break in the right spot, we could pull them from memory.
To control, modify, or patch the program
An example of such a situation where we would want to modify the malware is if we are using a virtual machine like VirtualBox or VMWare to analyze the malware and then malware has anti-virtual-machine detection. In this case we have 3 options: Try to mask the fact that we’re using a VM, use a physical machine instead of a VM, or use a debugger to find where the program checks for the VM and then patch it so that the check turns out negative and the program does not know that we are using a VM. This is a simple task using a debugger. Some malware programs also search memory for known anti-malware and analysis tools and these can be handled in a similar fashion. In fact, debuggers are so powerful that an entire program could be altered to behave differently from what the original developer intended. Malware could be removed from a program altogether if desired.
To decrypt, unpack, or deobfuscate either the entire program or some portion of it
This may be the single most useful ability of a debugger for malware analysis. Most people are at least a bit familiar with compression. Zip files use compression algorithms, which are functions that are able to pack data into fewer bytes and come with instructions on how to unpack/expand the data when desired. This is mainly useful for conserving disk space and/or sending other people files. However, a side-effect of compressing files is that they are no longer in their original format and many security suites check file data in order to flag malware. Since the malware is not in its original form, it bypasses detection. These files are then unpacked, you guessed it, at runtime. This means that in order to view the file’s actual malicious instructions, the file must be run. Encryption is not necessarily the same thing as compression, but data can be decrypted with a debugger in a similar fashion as they can be decompressed/unpacked.
There are other tertiary reasons why an analyst may want to use a debugger but they all fall into one of those basic categories.
What knowledge is needed and where can it be attained?
You’re probably wondering why we don’t dive straight into the tool now. This is because it can be intimidating to look at without proper introduction. To effectively use a debugger, it’s important to know some x86-64 assembly, or the assembly language for the architecture that the malware was built for. It may not necessarily be x86, but most malware is developed for x86 since it is a very prevalent platform. Another popular architecture is ARM. There are books such as Modern X86 Assembly Language Programming: 32-bit, 64-bit, SSE, and AVX 1st ed. Edition, by Daniel Kusswurm and the Intel 64 and IA-32 Architecture Developer Manuals which together can get you up-to-speed on assembly language. However, many malware analysts and reverse engineers start with books such as Practical Malware Analysis, by Andrew Honig and Michael Sikorski, Practical Reverse Engineering by Alexandre Gazette et al., and using these resources together with practice working on “reversemes” and “unpackmes” which are real-world files that are used specifically to hone reverse-engineering and analysis skills with debuggers and disassemblers. YouTube also has some great content from professionals in the field and hobbyists alike.
In addition to learning the instruction set, it is crucial to know about the internals and APIs of the operating system where the analyst is working. The reason why is even if the analyst knows assembly language, without knowledge of the operating system, system calls and procedures will be foreign and knowing how to spot malicious behavior becomes difficult. To learn the proper knowledge in this area for Windows, Windows Internals 7th Edition Part 1 (and 2 when it is released) by Mark Russinovich et al., What Makes It Page by E. Martignetti, and reading the OS API calls as needed in the MSDN are crucial.
Finally, one last area of expertise that will be tremendously helpful is learning about the Windows Portable Executable File Format. Information on this file format can be found in the article Peering Inside the PE: A Tour of the Win32 Portable Executable File Format, by Matt Pietrek, Corkami’s PE Format documents, and playing with the pefile Python library, by erocarrera
All of this information is not needed up front before starting, but it helps to be reading through it as you begin debugging as a form of malware analysis. You will thank us later.
What we are doing
We will explain how to unpack a generic UPX-packed file. Each packer can operate differently but these types of packers have what’s called an unpacking stub at the beginning of the file. An unpacking stub is simply program code which tells the computer how to turn the compressed file back into it’s expanded, operable version. In packers like UPX and ASPack, all we have to do is find where the packing stub begins and where it ends. By doing so, we know that data following then ending of the packing stub is the program that we are looking for. To do this, we will look for a specific instruction which is both directly before and directly after the unpacking stub. Once we know the stub has unpacked the file, we thus know that the unpacked code is active in memory. We will locate this code and then save it to disk so that we don’t have to go through this process again to analyze it in the future. We could also run the file once we repair the Import Address Table which we will discuss in a future blog. It is important to note that this is a two-step process: Step one is unpacking and saving the code and step two is repairing the Import Address Table.
Be aware that not all packers work in the way just described. Some are more difficult to deal with for two main reasons:
- Instead, they can unpack the code little-by-little as it executes rather than unpacking the entire executable at the very start of the program. This would prevent us from being able to easily dump the unpacked file to disk in one fell-swoop. These types of packers make the process a lot more tedious and may cause for automation. Some packers use virtual machines too which highly obfuscates the code. Packers in this category include Themida/WinLicense and VMProtect. However, these packers also have disadvantages, specifically when it comes to performance which is why they are not super commonly used.
- They use anti-debugging tricks. Anti-debugging tricks generally either try to crash the debugger, alter the behavior of the program when a debugger is detected, or lock up the analysis. Some of these packers implement anti-debugging tricks in addition to the above. There are many tricks and we will have to leave them for another post, but generally speaking, the program can check data in various parts of memory to locate signs of a debugger and then act upon those signs. You may wonder how this occurs when we are actively stepping through a program and we have full control over it. Wouldn’t we notice anti-debug tricks in the instruction ahead? To a large extent, we would if we knew what to look for, however, most of these tricks are embedded deep somewhere in otherwise-boring areas… Areas which we would usually place a breakpoint past and run (F9) over. While the instructions are executing quickly and the analyst is not watching, the anti-debug technique will execute and detect the debugger.
We will not be handling those two types of packers in this post but even still, the concept that there is code which is unpacking data in memory is the same and the analyst’s understanding of it can help defeat even those types of packers after an analyst gains more experience.
The tools
Ahhhh, the fun part at last! Time to go over the tools necessary for the job.
OllyDbg
This is the most well-known debugger, but it is also old and no longer supported well. It is still useful for malware analysis because although it does not fully support x64 debugging, most malware is 32-bit so that it is compatible with more machines. OllyDbg also has a ton of useful anti-anti-debugging plugins, which we will explain in more detail later.
x64/x32Dbg
This debugger is currently fully supported and much newer than OllyDbg. It is made by folks who used to use OllyDbg and therefore has a very similar design and many of the same hotkeys. Also, several features which were plugins in OllyDbg come standard with x64Dbg. Finally, as the name suggests, it supports 64-bit file debugging.
WinDbg
WinDbg is a real behemoth. It has a different design from OllyDbg and x64Dbg, a separate scripting language, and it has a ton of power for Windows debugging. Unlike OllyDbg and x64Dbg, WinDbg is made by Microsoft and is able to perform kernel-mode debugging; essentially, WinDbg can sit in the kernel and freeze the entire machine up, stepping through the instructions one-by-one. Due to this, WinDbg requires 2 separate machines or one virtual machine when performing kernel debugging. WinDbg is also very capable of user-mode debugging and has great support for Win32 and kernel API symbols.
GNU Debugger (gdb)
Many times, gdb will already be installed on Linux machines, which can be discovered by typing “gdb” at the terminal. gdb can be downloaded for Windows as part of the MinGW suite. gdb is a very powerful native debugger often used by C programmers. Unlike the previously-mentioned debuggers, gdb uses a command-line interface and not a GUI. While this may take some getting used to, many people are surprised at how intuitive and effective it is as a debugger.
radare2
radare2 is actually a complete toolset rather than just a debugger, which includes a disassembler and many other binary analysis tools. The upside to radare2 is that it is extremely powerful and free. The download to radare2 is that the commands have a steep learning curve to all but those who love command-line interfaces, and even sometimes those people still find radare2 difficult to learn. The good news is, if an analyst can overlook the giant menu of commands and get used to using just the few core commands, radare2 can become a very powerful tool.
We’ve introduced 5 debuggers here to clear up confusion and to give analysts multi-platform options. However, in this article we are focusing on the OllyDbg/X64 style Windows GUI debuggers.
The Interface
I’ve seen more than a few people get shown a debugger and instantly curl up into a ball and never want to see the thing again… Ok, it wasn’t that bad, but without an introductory tour, the interface can be a bit intimidating for newbies. For this reason, we will go over it below:
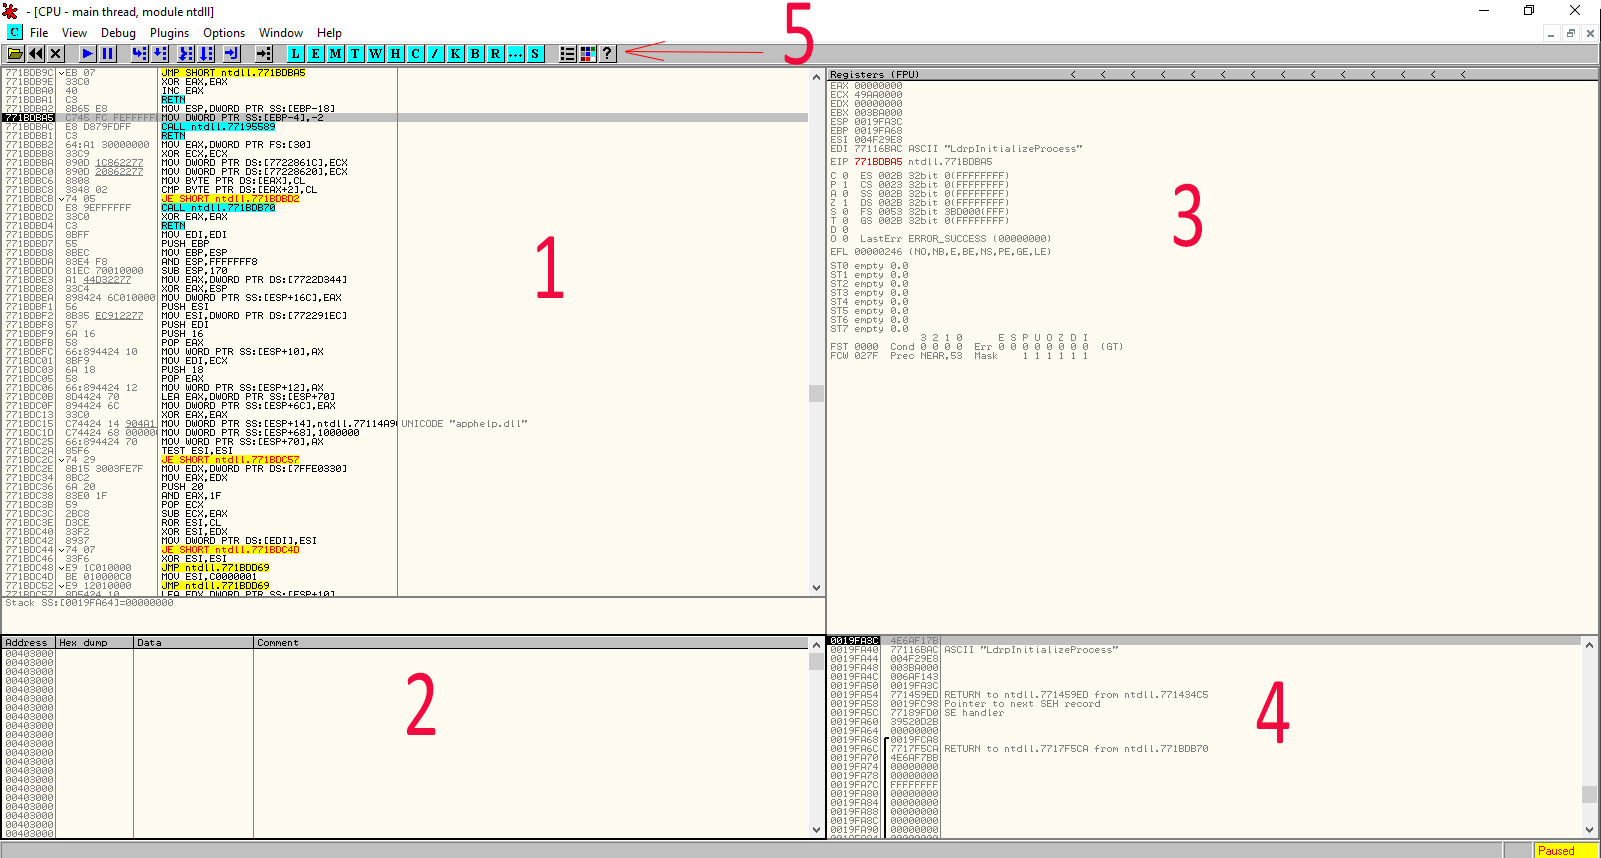
1. The Disassembly
This section displays the x86-64 disassembly instructions. This is probably the most-used section as analysts will spend much of their time stepping through and placing breakpoints in the program and watching execution here.
2. The Hex Dump
This is very much like would you would see in standard hex editor such as HxD or WinHex. The difference is that since it is part of the debugger, OllyDbg and X64Dbg allow you to right click any memory address in any other window area and click “follow in dump” which instantly snaps this hex editor to the area in memory for viewing or editing. This is a very helpful feature. The hex dump also allows placing breakpoints on memory areas which we will also discuss later.
3. The CPU registers and flags
If you are confused as to what these are, you really need to check out the resources in the previous section as explaining how the CPU works is outside the scope of this post. To summarize, they are similar to “in-CPU memory” and bit flags. Being able to see exactly what is inside the CPU at any given time while the program is executing is extremely powerful. Many times, the CPU registers will hold pointers (addresses of other values), so the right-click “follow in dump” option is very helpful here.
4. The Call Stack
When functions are called, their local data is pushed onto “the stack.” The stack can be viewed in real-time in this section. It can be useful for viewing return addresses and function arguments.
5. The rather confusing buttons
These buttons can be used to step through code and access the various windows in OllyDbg. X64Dbg uses a slightly different approach and mainly features tabs for accessing the other windows. Either way, we will cover hotkeys in this post so to limit the need to click the buttons in the first place.
Unpacking a UPX-packed file
Rather than ramble on like a user manual, we’re going to jump right into one of the most useful and most difficult malware analysis activities: Unpacking a compressed file.
We’re going to start with a standard packed file called UPX. The reason for this is UPX is a very common packer used by malware authors but it is also easier to unpack. There are packers which are specifically designed to be reverse-engineering/analysis resistant and unpacking them is similar but just involves many more steps and can be tricky if the analyst misses a step. For this reason, when unpacking a file it is a good idea to place breakpoints near each step and even use virtual-machine or regular machine snapshots in case control of the program or machine is compromised by the malware.
Step 1: Run the debugger as Administrator
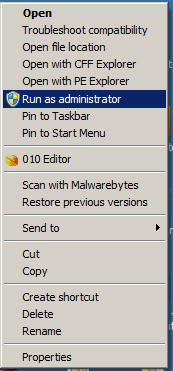
This is an important step that is often overlooked. Debuggers need to call special functionality in order to override the program that they are “attached” to. In order for this to be most effective, they work best when they are run as admin.
Step 2: Click File -> Open and open the UPX packed file
Step 3: Look for a PUSHAD or a PUSHAL instruction
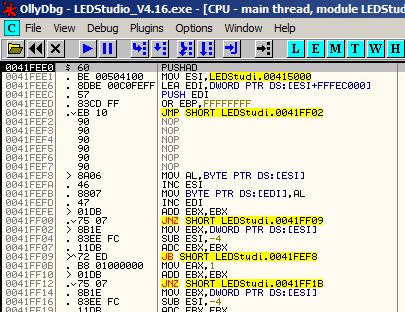
You should see a PUSHAD or a PUSHAL instruction at the top of the disassembly window. If you do not, see Option #3 below. Otherwise, Press F7 once to “step into” the PUSHAD or PUSHAL operation.
Step 4: Locate the POPAD/POPAL instruction

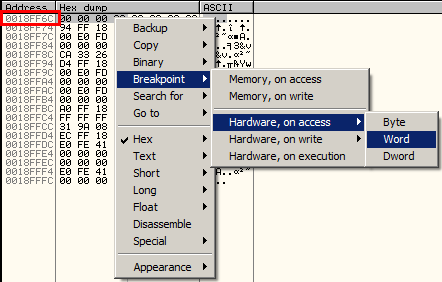
Option 1: Right click ESP as shown and click “follow in dump,” Then highlight the first 4 bytes in the dump and right click -> hardware breakpoint -> On access -> Word
Option 2 (less reliable): Hit Ctrl+F or right click in disassembly window -> Search For -> Command – type in “POPAD” or “POPAL” in the box and click OK. When the results show, locate the memory address closest to the PUSHAD/PUSHAL instruction. This option may not work because the PUSHAD/PUSHAL instruction may not even be loaded until sometime while the file is being unpacked. So if this way does not come up with a POPAD at all or has one which is not near a bunch of obscure bytes, you will likely need to use option #1 or #3. Here is a shot of a list of found popal calls in x32Dbg:
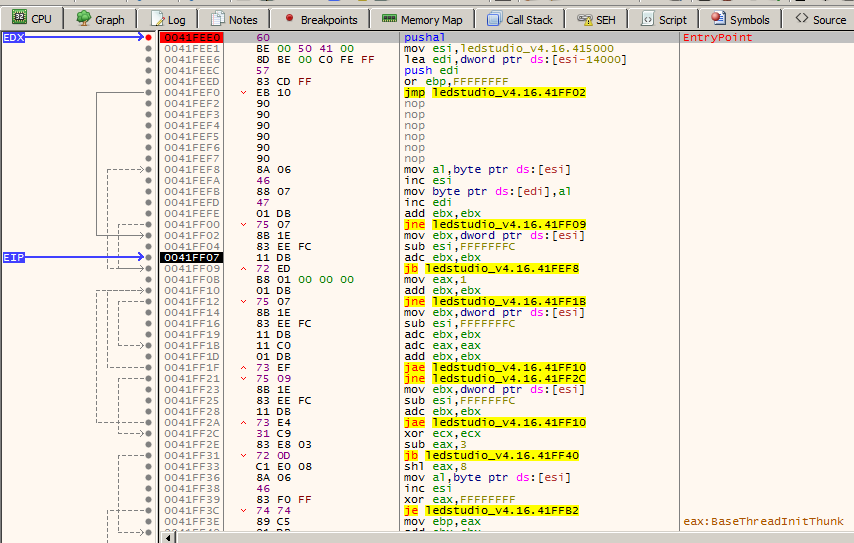
Option 3 (most reliable but more time consuming): Simply just step through and examine assembly by mashing the F8 key over ntdll, kernelbase or other types of functions and when execution goes into the actual program (you will note that function calls will go from call ntdll.NtCreateFile or kernel32.WriteFile to yourprogramname.41FF09 for example). Once in or around the main program code, you can often spot the PUSHAD/PUSHAL above it. Breakpoint it with F2 and then restart the program by clicking the refresh button in x64Dbg or the << button in OllyDbg. Now, press F9 and the program will run until it’s sitting right on the PUSHAD call. Press F7 one time and you will be right where you need to be for the remaining instructions listed in Option #1. Below is a shot in x32Dbg where we found a PUSHAL instruction manually. This occurred because x32Dbg stopped the program several functions before the PUSHAD. We had to press F7/F8 and step through a few functions to get to this PUSHAD first manually as described above. It’s highlighted red because we placed a breakpoint there:
Step 5: Locate the unpacked code
The reason we go to the POPAD/POPAL instruction is because this is the point where UPX is about to restore normal execution of the program after the code has finished being unpacked. In a technical sense, what we are doing here is not unpacking the program manually. Instead, we are allowing the unpacker to unpack the program, stopping program execution directly after, and then taking the now-unpacked program and saving it to disk for examination. To locate the unpacked code with UPX, we’re looking for a jmp or call instruction which sits just above a bunch of blank or other strange bytes like so:
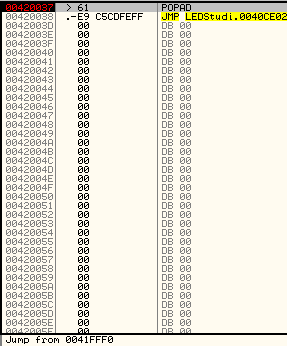
It may be a challenge at first to spot, but this becomes easy to spot after a few tries. What we now want to do is place a breakpoint on the instruction POPAD/POPAL and then press F7 until we get to the jmp. When we’re sitting on the JMP, we press F7 one more time and then the unpacked code will appear like so:
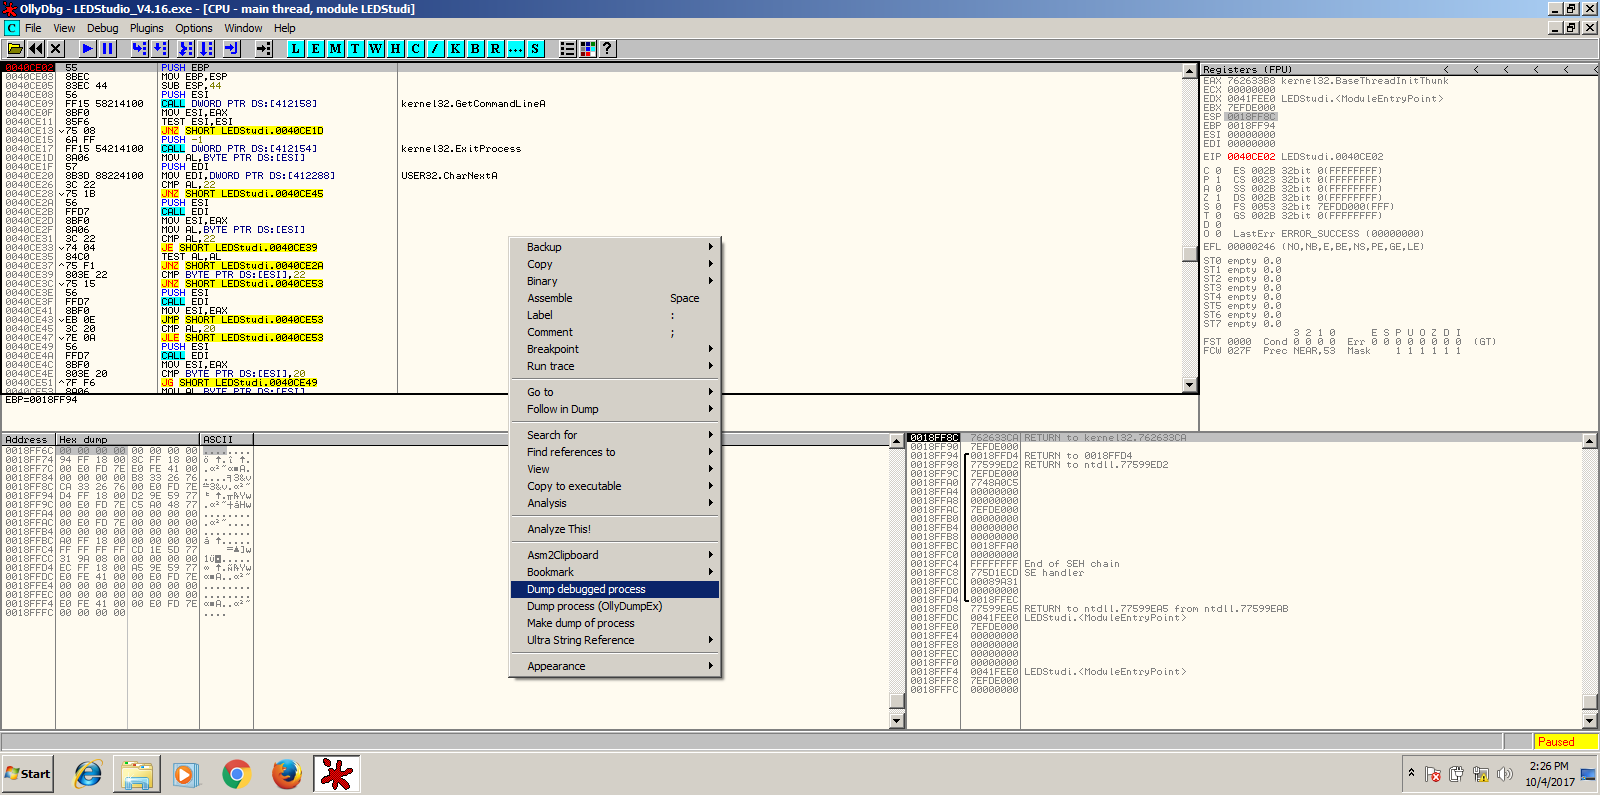
At this point, we can dump the unpacked code to disk using an OllyDbg plugin called OllyDump or OllyDumpEx. With this plugin installed, just right-click the disassembly area and click “dump debugged” or one of the variants shown in the above screenshot depending on which plugin you have. At any given time, if you can’t seem to locate something, please remember that you can scroll up and down the disassembly manually and do a quick scan with your eyes. This often proves more useful than one would think, even in hex editors!
At this point, we have the actual instructions unpacked and technically they could be examined in a worst-case-scenario situation. However, we do not have a valid executable file, even though we just dumped a .exe to disk. The reason why is because an executable on Windows is more than just code. The executable must have valid header data structures and a valid Import Address Table which tells the operating system which DLLs are needed for the program to run. Currently, our unpacked .exe has no valid Import Address Table. If this part is confusing, please see the resource mentioned about the PE File Format from Microsoft.
The next step involves rebuilding a proper Import Address Table for the program to load properly. This step can be pretty quick too but there is a lot of theory behind it that we will need to briefly cover. For this reason and the fact that this post is already quite lengthy, we’re going over the IAT rebuilding step in the next post, so stay tuned! In the mean time, if you have not read it, head over and read the PE File Format resources mentioned above.
Don’t Stress The Details/Conclusion
Every packer is different, every file is different, and even each packer can differ from itself version-to-version. When new to unpacking files, it is beneficial to follow a near reciple-approach to unpacking a few generics like ASPack and UPX. However, do not stress the details. The problem with paying too much attention to the details of each packer rather than seeing the big picture is that when you have to unpack a file with a custom packer, new packer, or other packer you otherwise have never done before, you will not know how to do it and won’t know how to solve the problem. Instead, get the higher-level concepts of what packers are doing, how they operate, how various Windows APIs are used, and know how to figure out where in the file you are. With that knowledge and some experience, a problem-solving process can be followed to unpack strangely-packed files.