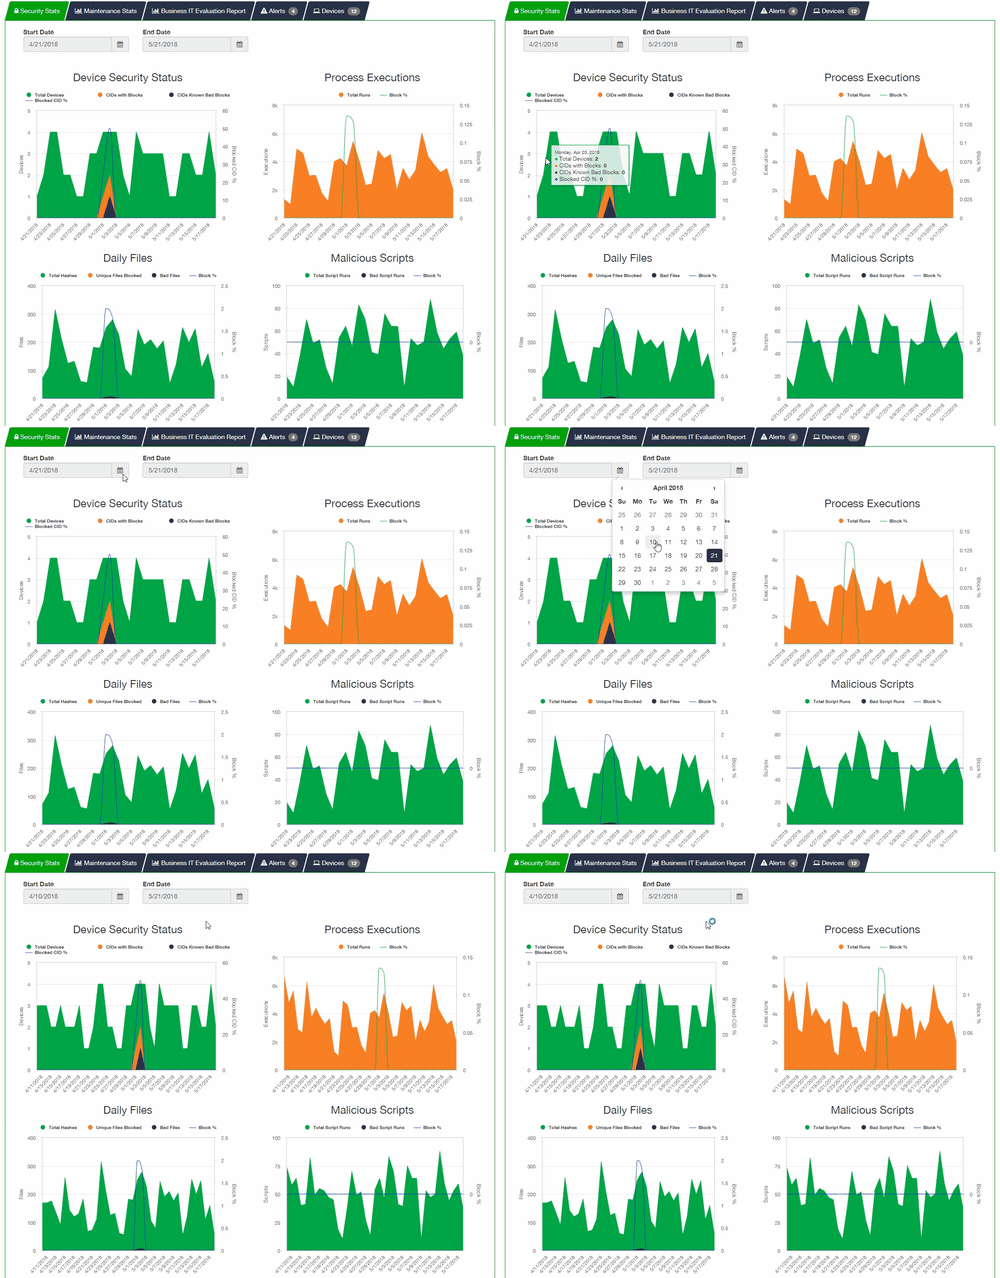
Today we released a new view in your management console to provide data visualization and insights into the activity and behavior of your devices. After logging in, check out the new default tab – Security Stats! Here you’ll see several views covering Device Security Status, Process Executions, Daily Files, and Malicious Scripts.

Chart Details
Device Security Status
Total Devices – Count of devices online each day.
CIDs with Blocks – Count of devices with blocked executions.
CIDs Known Bad Blocks – Count of devices with known bad executions blocked.
Block CID% – Percentage of devices with executions blocked.
Process Executions
Total Runs – Total amount of processes running on all devices. (non-unique)
Block % – Percentage of executions that were blocked from running.
Daily Files
Total Hashes – Count of unique hashes run across all devices.
Unique Files Blocked – Count of unique files blocked across all devices.
Bad Files – Count of bad files across all devices.
Block % – Percentage of files that were blocked from running.
Malicious Scripts
Total Script Runs – Sum of scripts run across all devices.
Bad Script Runs – Sum of bad scripts blocked across all devices.
Block % – Percentage of scripts that were blocked from running.

