Map of Best and Worst Internet Connections in the US
Post by PC Pitstop.
The map shows relative download speeds (by congressional district*) across the contiguous U.S., based on January through July data from over 5,600 cities and towns represented in Ookla’s Net Index. Blue means a faster download speed than the national average of 18.2 Mbps, while red means a slower download speed.
—Gizmodo 9/5/2013
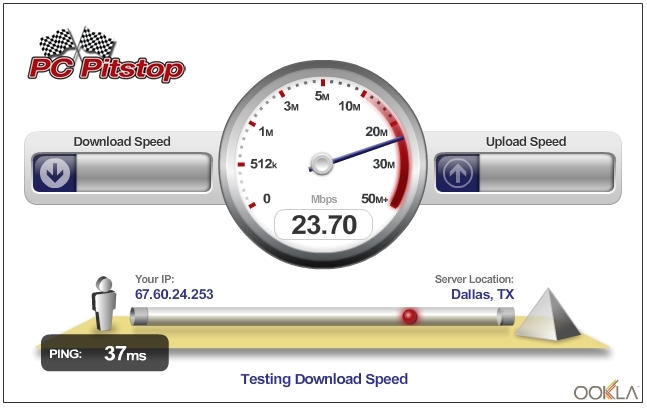
PC Pitstop offers a FREE Internet Speed Test.
Test Your Internet Speed and Post Your Results Here